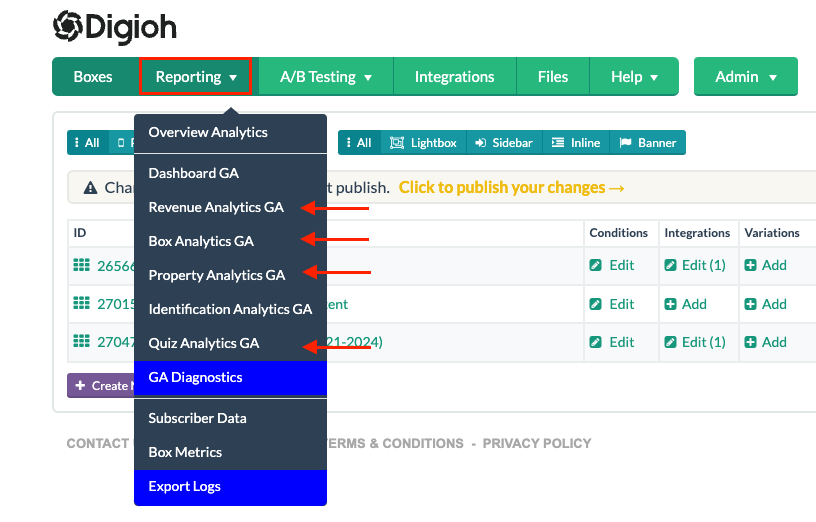
The reports that available in your Digioh account by default:
- Revenue Analytics
- Campaign Analytics
- Property Analytics
- Quiz Analytics
To access all your reporting you will need to find the “Reporting” tab on your top navigation bar on your account. It is important to note that to access these reports you will have to connect your Google Analytics account (see below)
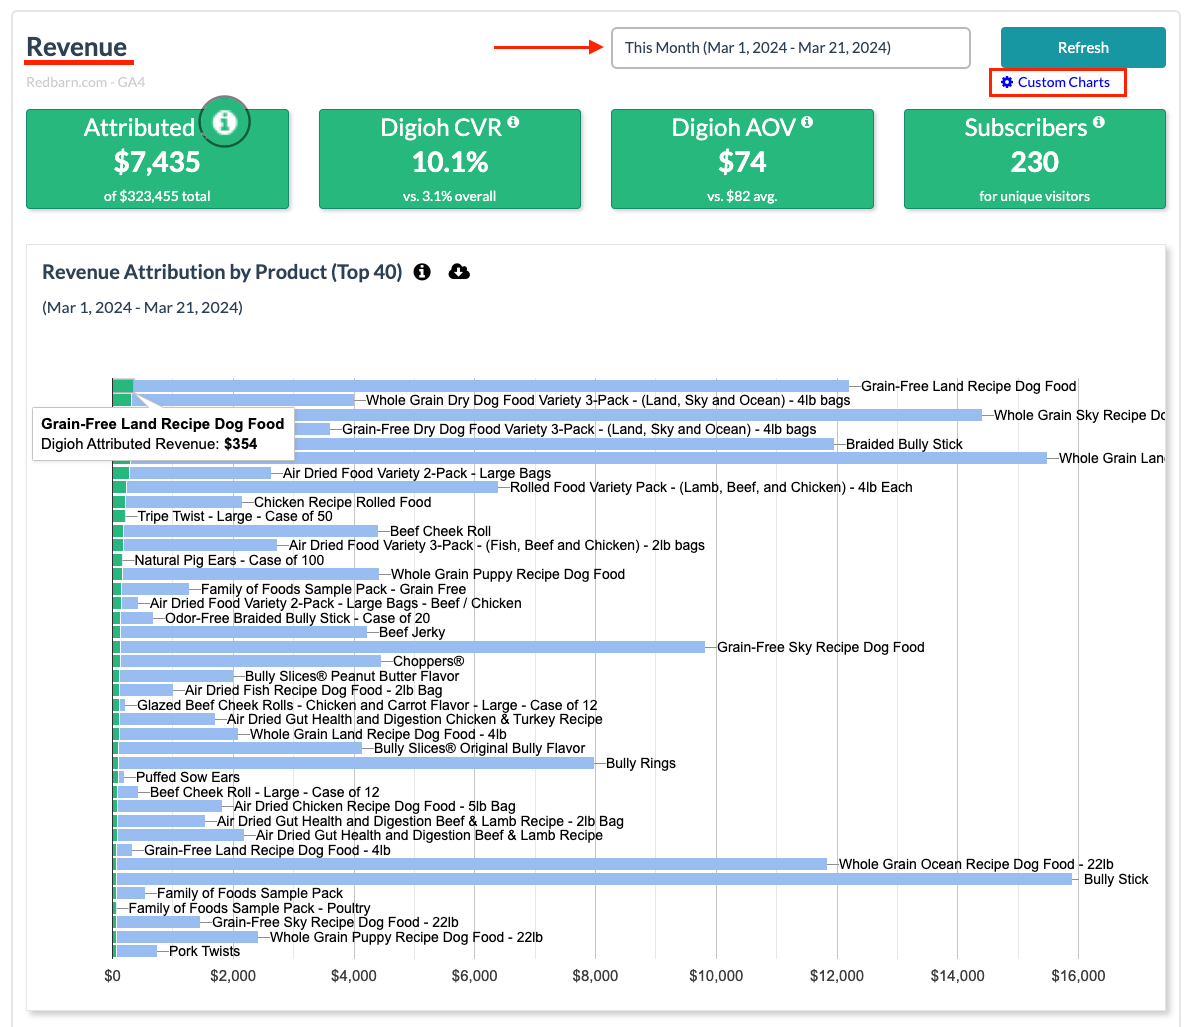
Revenue Analytics
This dashboard explains the following reports in a specific time window:
- Attributed – This number is the revenue for visitors engaging with Digioh Campaigns and purchasing same day.
- Digioh CVR – Purchase Conversion Rate for Digioh engaged attribution visitors.
- Digioh AOV – Average Order Value
- Subscribers – Emails or phone numbers collected for unique visitors new to Digioh.
- Revenue Attribution by Product – This is the breakdown of the customer products and the revenue attributed to Digioh and the regular site.
- Digioh Attributed AOV vs Avg. AOV by Day – Comparison between Digioh’s attributed order value vs the Customer’s AOV.
- Digioh Attributed Revenue by Day – Revenue attributed to Digioh if the visitor makes a transaction the same day as they engaged with a Digioh Campaign.
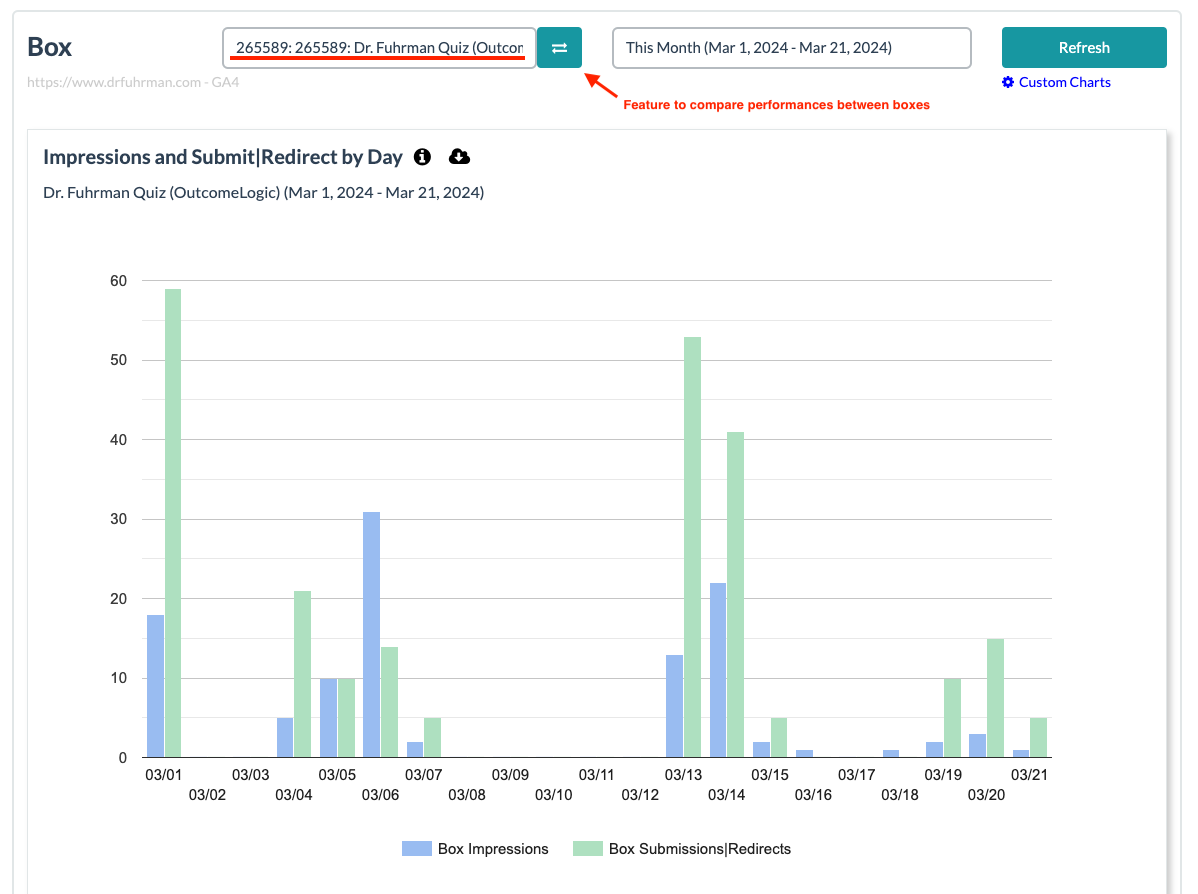
Campaign Analytics
This dashboard will help explain the performance of a specific campaign in a specific time window. A special feature within this tab is the ability to compare performances between different campaigns in your Digioh account. Reporting available:
- Impressions and Submit – Campaign impressions alongside submissions or redirects by campaign.
- Email & Phone Collected for Campaign Impressions – Total number of emails and phone numbers collected by this campaign.
- Avg. Time on Page – Average number of seconds that users spend on each page for this campaign.
- Audience Penetration for Campaign – Percentage of visitors that saw the campaign over a time period.
- Opt In Status – Number of submissions for this campaign.
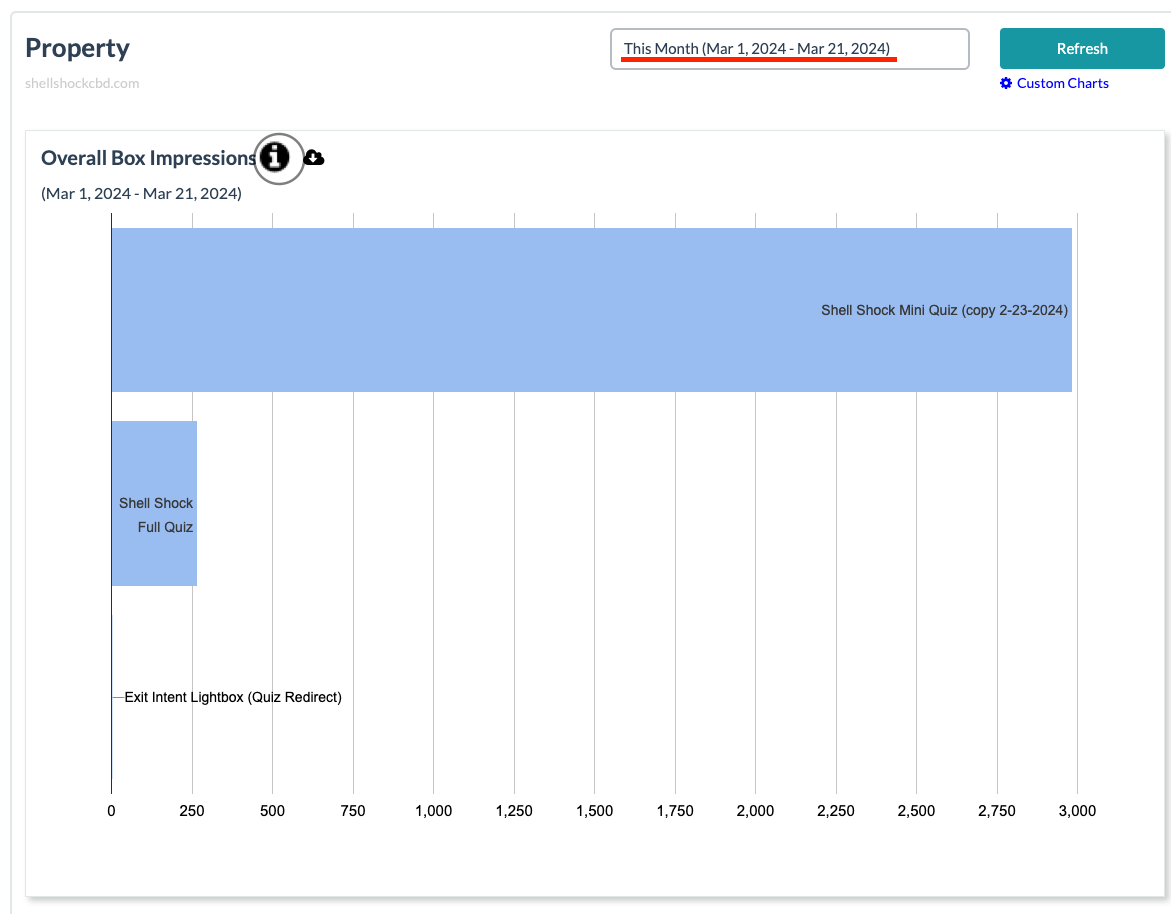
Property Analytics
The goal of this analysis is to showcase the impressions and visitors the campaign had over a period of time. Both reports are:
- Overall Campaign Impressions – Impressions for all campaigns in your Digioh account.
- Overall Campaign Audience Penetration – Number of visitors that saw the campaign over a time period.
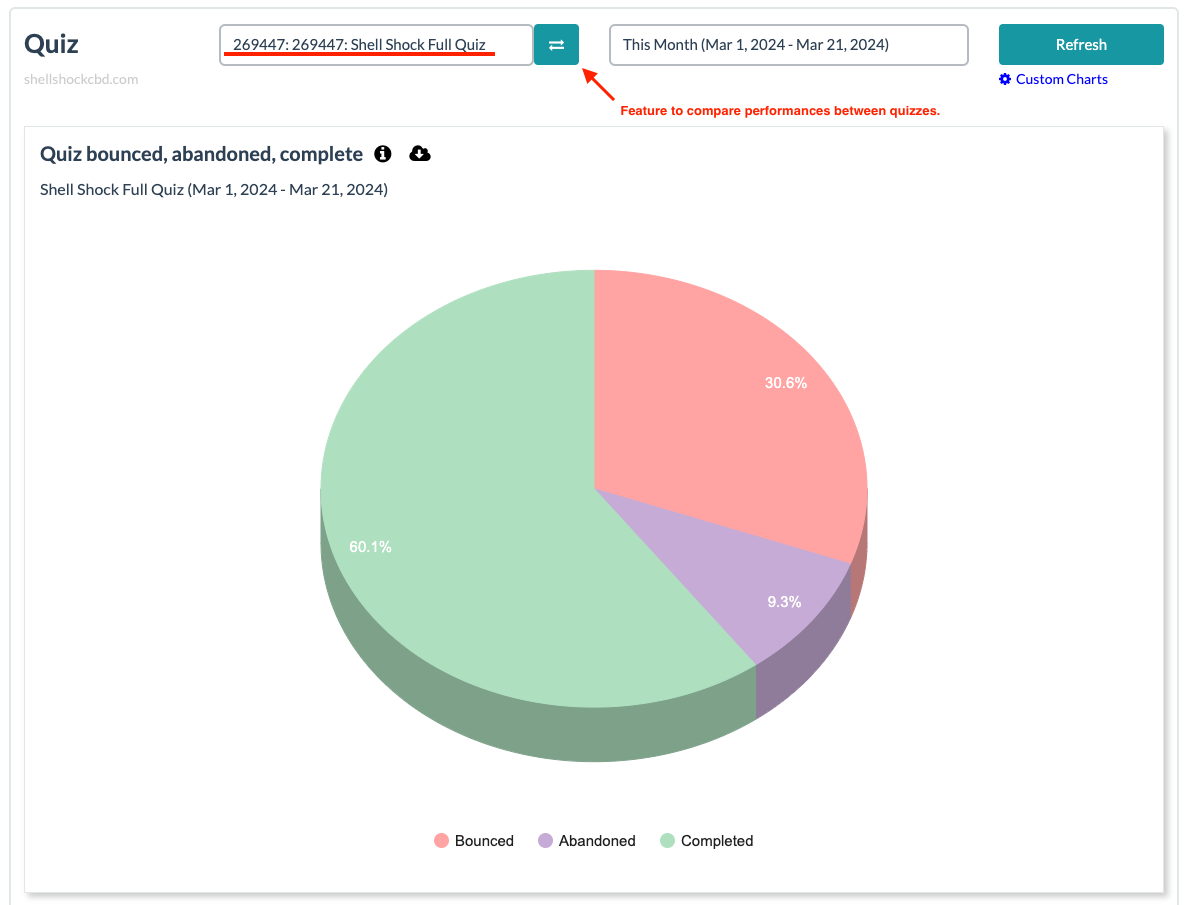
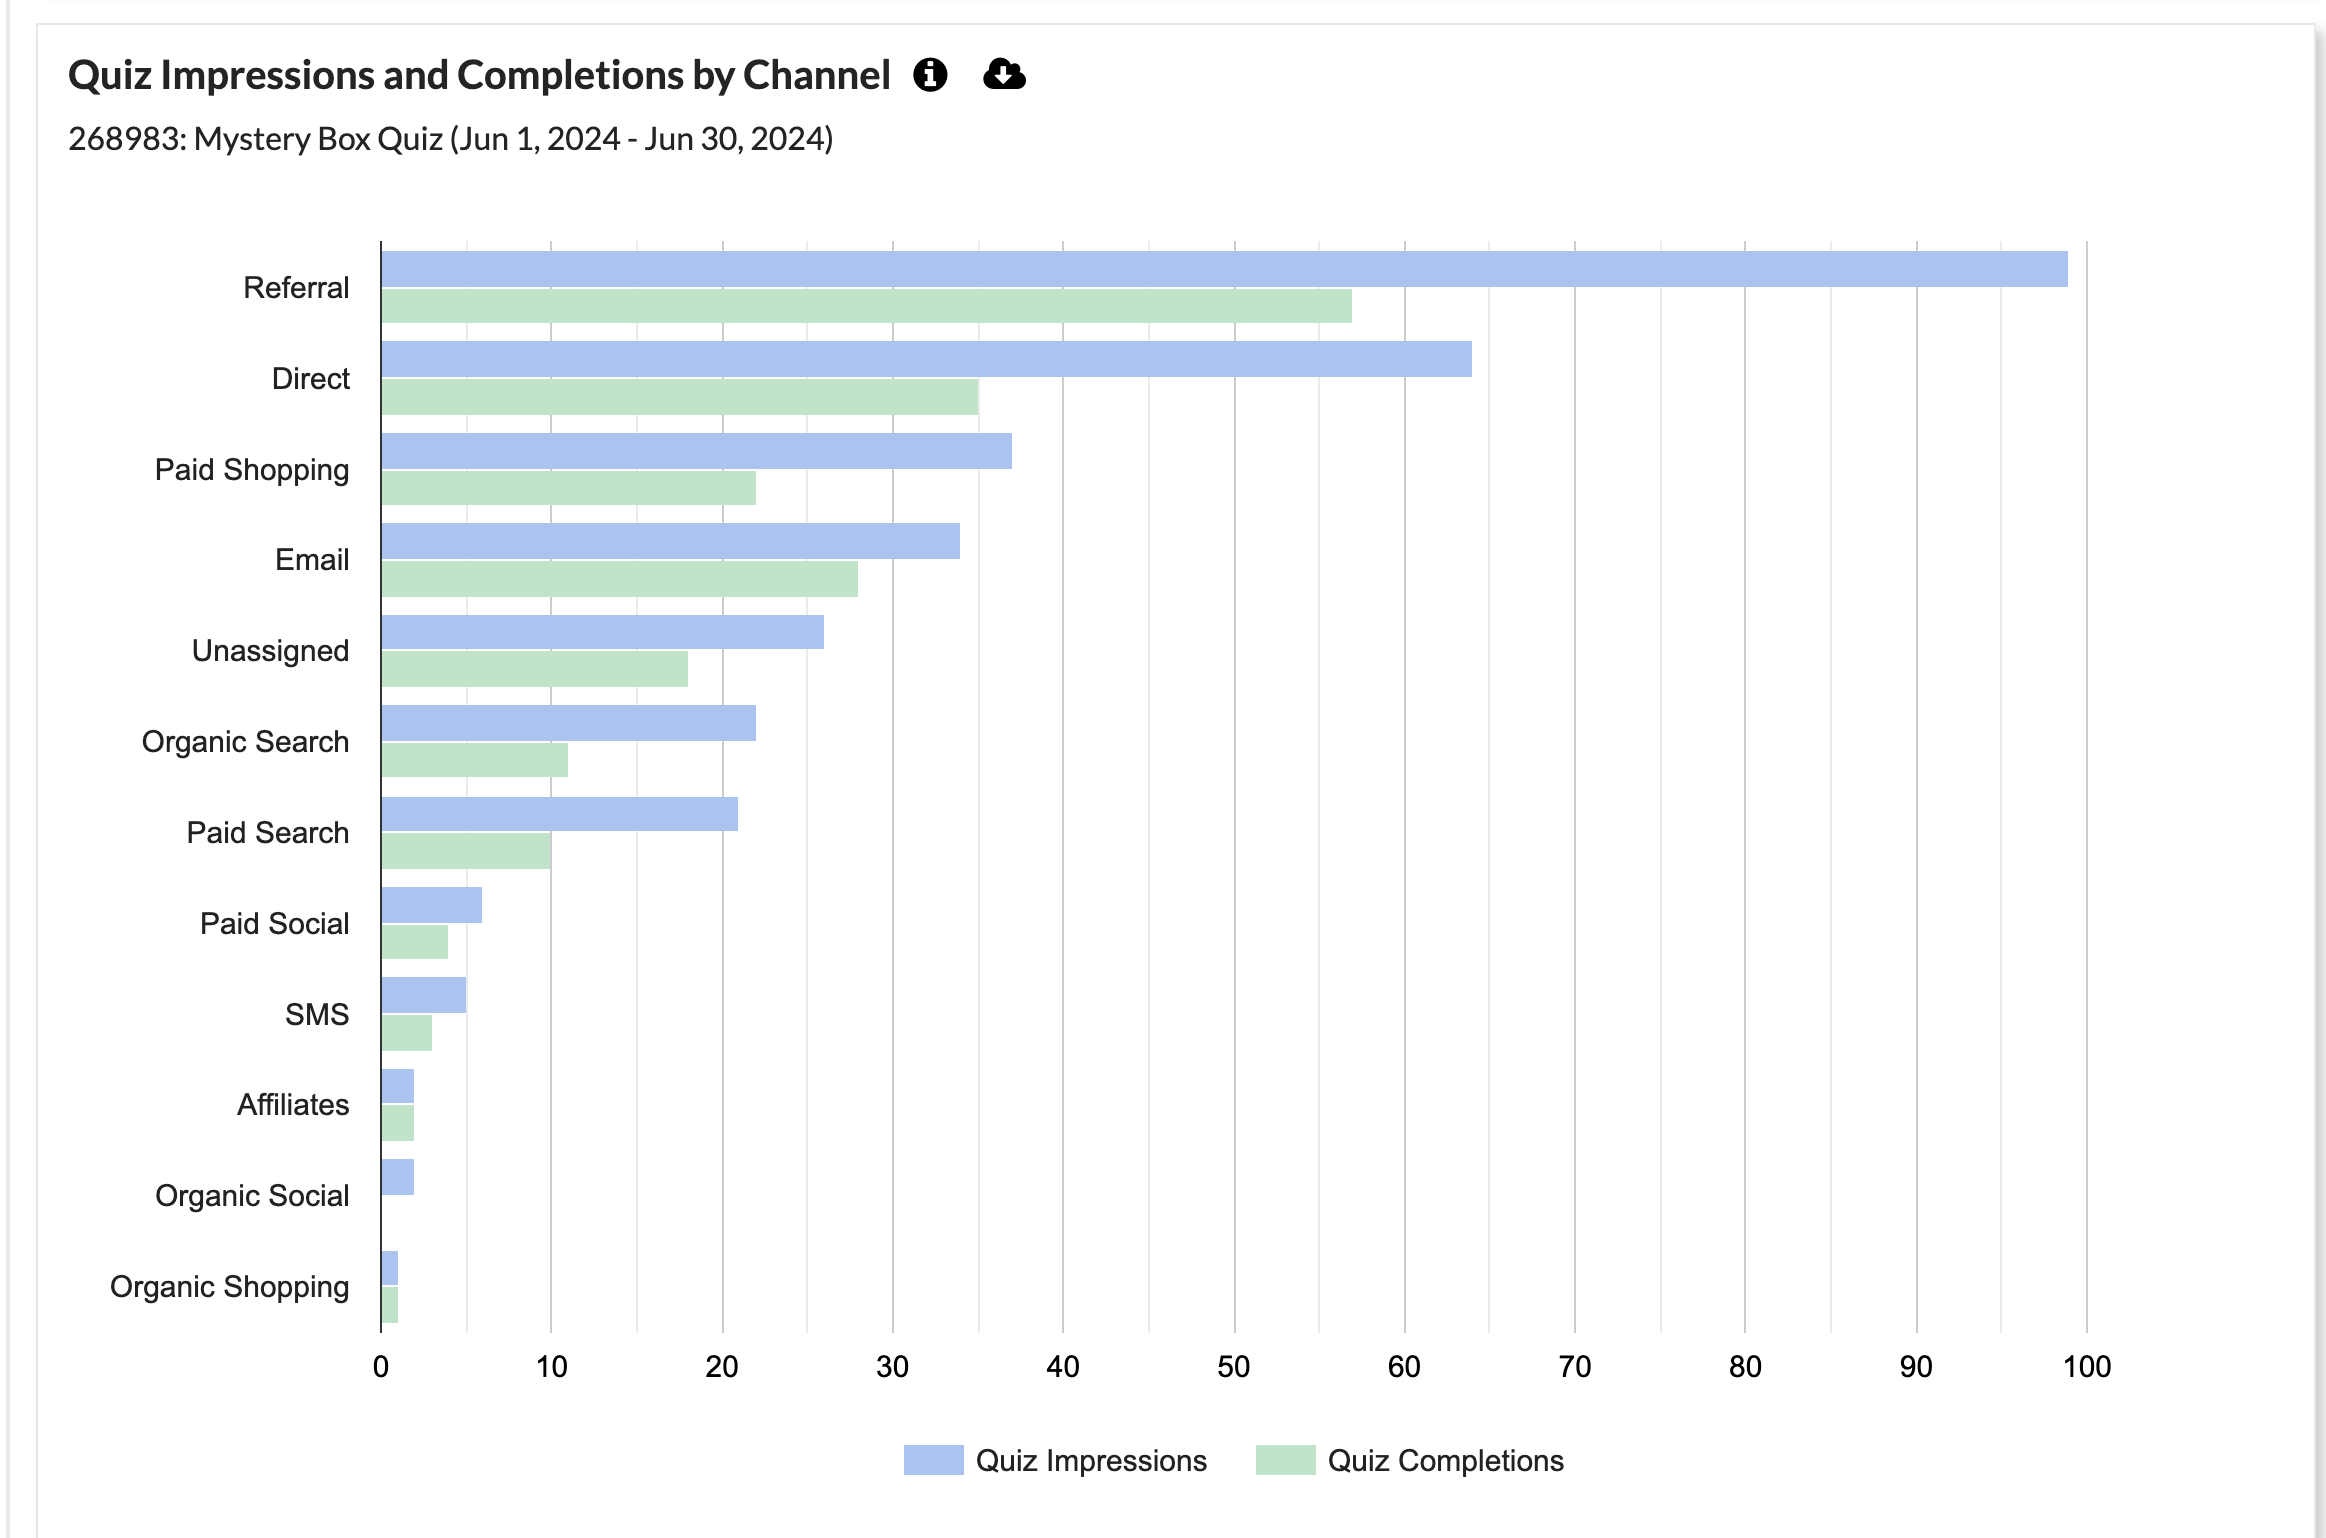
Quiz Analytics
This dashboard is specifically designed to analyze the performance of a quiz, and compare the performance between quizzes in your account over a period of time. The reports included are:
- Quiz Bounced, Abandoned and Complete – Breakdown of how many visitors completed, bounced and abandoned the quiz.
- Email & Phone Collected for Completed Quiz – Total emails and numbers collected by this quiz.
- Quiz Impressions and Completions – Comparison between the impressions and completions of the quiz.
- Quiz Funnel Drop Off – Progression of the quiz and their number of drop offs.
- Avg. Time on Page – Average number of seconds that users spend on each page for this quiz.
- Quiz Answers by Question – Number of answers grouped by question.
- Quiz Recommendation Top Result – Breakdown of the #1 recommended products results across your quiz.
Drop Off Reporting
One of our favorite reports in Quiz Analytics is Drop off Reporting, which is also shown at a Channel level. You can look at each step and understand where the most drop off is and then decide if you show, modify or remove the question to improve your overall quiz completion rate.
Custom Tracking Parameters
- In the reports, you can add URL parameters to entry points to track where the best customers are coming from. So for example if you have a quiz embedded on your top nav bar, Exit Intent, and an embedded quiz in your email. You can add tracking URL parameters and see which path gets the best results.
- In order to add tracking, just add the parameter dctx=
- So for example here are some URL parameters
- dctx=top_nav
- dctx=exit_intent
- dctx=embedded
- dctx=ANYTHING_YOU_WANT
- So for example here are some URL parameters
Note: dctx stands for “Digioh Context”
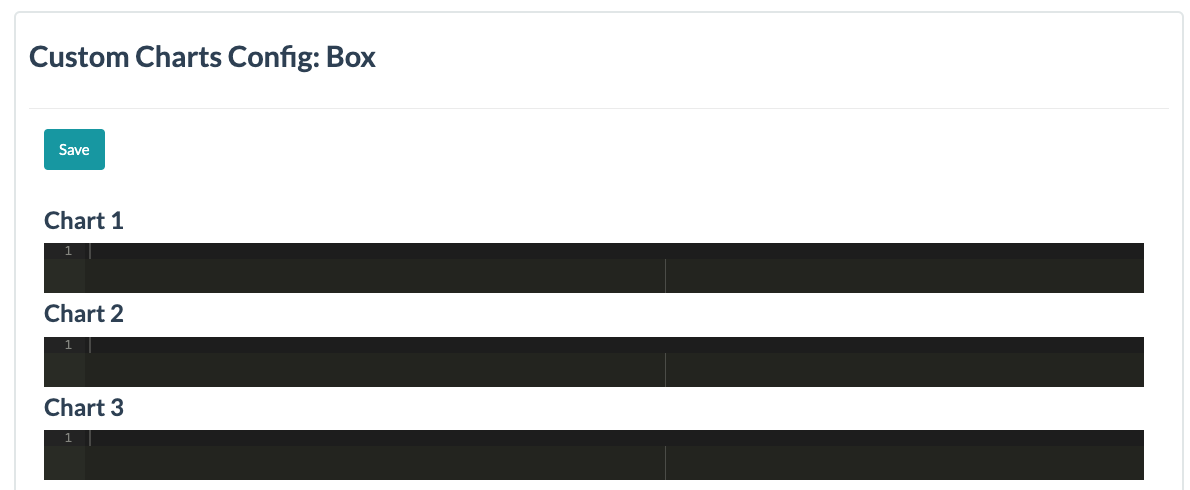
Custom Dashboards
Custom dashboards and charts are available on request. This can be configured by a technical team member.
Important notes on reporting:
- For any questions on what each report means, don’t forget to review the information bubble.
- The time windows available to review these reports are weekly, monthly, quarterly, and yearly.
- These reports are fed by Google Analytics.