What You’ll Learn in This Article:
- How to access and navigate Digioh’s Reporting section.
- The types of reporting available: subscriber data and campaign metrics.
Subscriber Data
Hover on the Reporting tab from the top navigation bar, and then click on Subscriber Data.

This section provides email, web source, geolocation and date of lead for each submission collected. Note that you can filter by campaign name and/or date range by selecting a campaign name and/or date range to the left of the search button. Also, you have the ability to look at submission data individual campaigns or for all campaigns by selecting ALL CAMPAIGNS.
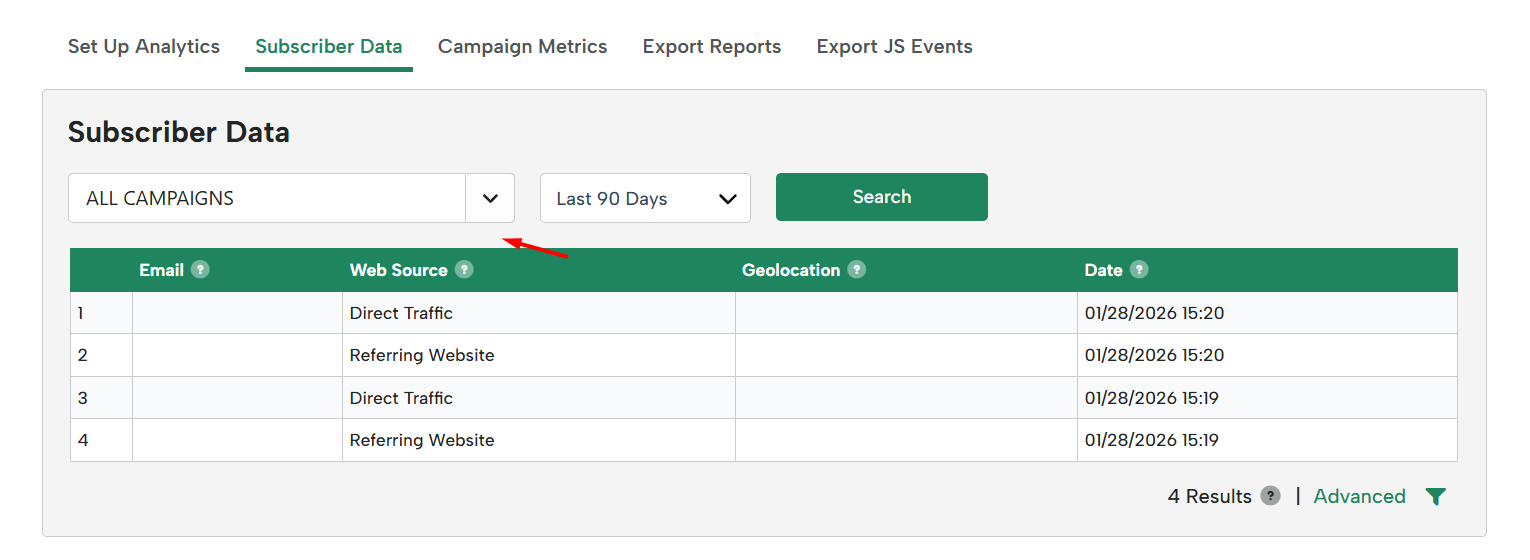
Use advanced button to filter, display, and export data captured for each submission. For more information: How to View and Export Campaign Submission Data in Digioh
Campaign Metrics
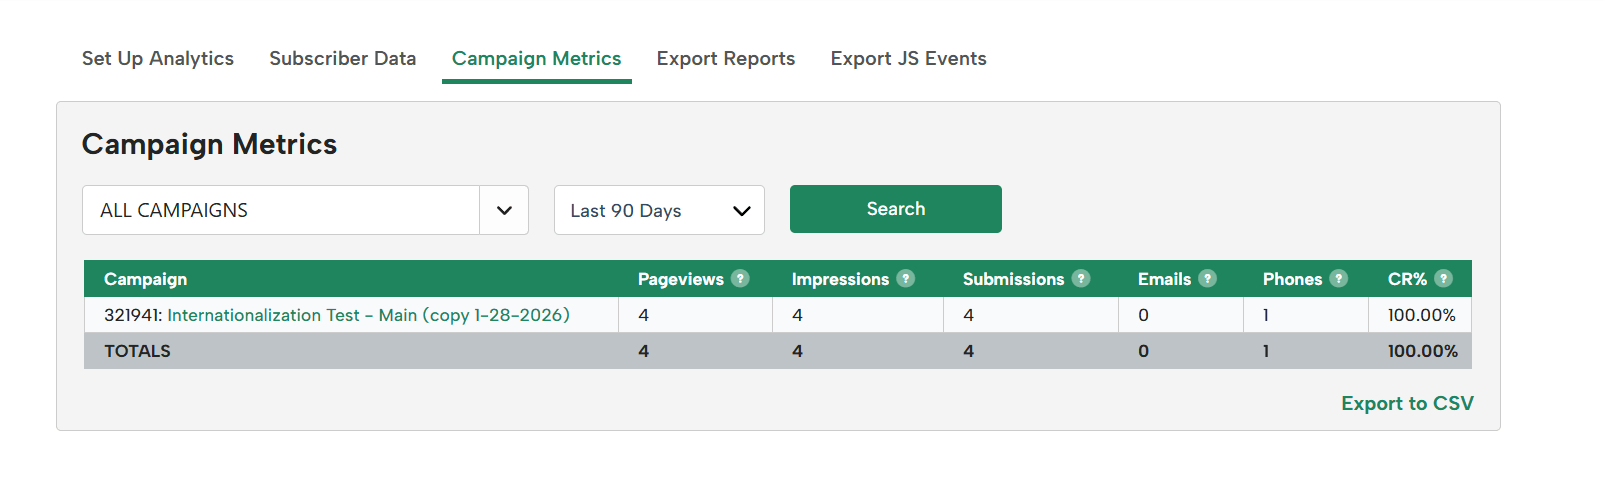
Hover on the Reporting tab from the top navigation bar, and then click on Campaign Metrics.

-
- Pageviews = Number of times your website is loaded (regardless of how many times your campaign shows up)
- Impressions = Number of times your campaign is displayed
- Submissions = Number of times someone enters their info into your campaign
- Emails = Unique count of email addresses captured by the campaign
- Phones = Unique count of phone numbers captured by the campaign
- Redirects = Number of times a button that goes to a link is clicked on
- Downloads = Number of times a downloadable asset is accessed through the campaign
- CR% = Conversion Rate, calculated as Submissions divided by Impressions. For example, if a campaign received 897 impressions and 100 submissions, the CR% would be 11.15%.