Google Analytics Integration Quick Links.
Overview
Revenue and Campaign Analytics is only available after you have connected Digioh to your Google Analytics Property.
By connecting Digioh to GA4, you can analyze how interactions with your Box and Quiz Campaigns influence your revenue, and analyze engagement with your Digioh Box and Quiz Campaigns. Digioh tracks Campaign interaction data to your existing GA4 instance, this data is additive and will not affect any of your existing reports in GA4. We combine our data with existing data in GA4 so that it becomes a “single source of truth” for your revenue and visitor behavioral data. The data that you see in Digioh you can also see in GA4, we simply present it in a more accessible form.
Accessing Digioh Analytics
To access Digioh Analytics, you must have connected GA4 to Digioh and completed the setup process. Since there is a lag between event tracking and data being available in GA4, you typically won’t see data in Digioh (or GA4 itself) until the following day.
After connecting Digioh to your Google Analytics, new options will appear under the Reporting menu:
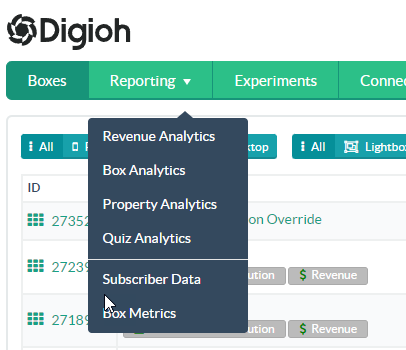
- Revenue Analytics: revenue focused reports and metrics, based on Digioh Revenue Attribution (see below).
- Box Analytics: Box Campaign interaction reports, e.g. impressions, form submissions, etc.
- Property Analytics: Site level reports, e.g. how many visitors are seeing a Digioh Campaign.
- Quiz Analytics: More detailed reports for interactions with your Quizzes.
- Subscriber Data: If you have Data Storage enabled, this is where you will find raw submission data. Note that this data is not stored in Google Analytics since it may contain PII.
- Box Metrics: This is basic raw engagement metrics for your Box Campaigns as recorded by Digioh servers. We recommend using Box Analytics above, but this data can be useful when troubleshooting or if you do not have Google Analytics.
Throughout the Analytics Dashboards, there are tooltips that can be found by hovering over the overview boxes listed towards the top of the page, as well as by hovering over the information icon on the individual charts:
Digioh Revenue Attribution
Digioh claims attribution for the total dollar value of purchases made on your site within 24 hours of engaging with a Digioh Box or Quiz Campaign. Revenue Analytics shows “global” attribution, the combined effect of all of your Box and Quiz Campaigns, but you can also enable Revenue Attribution for individual Box or Quiz Campaigns. This allows to drill down on the revenue impact of a single Campaign when testing with an Experiment, for example.
Key Reports
Revenue Metrics
Digioh Revenue Analytics is based on eCommerce purchase data in GA4 in conjunction with Digioh Standard Events.
Most reporting sections have a set of Key Metrics up top. For details on these, hover over the tooltip i icons.
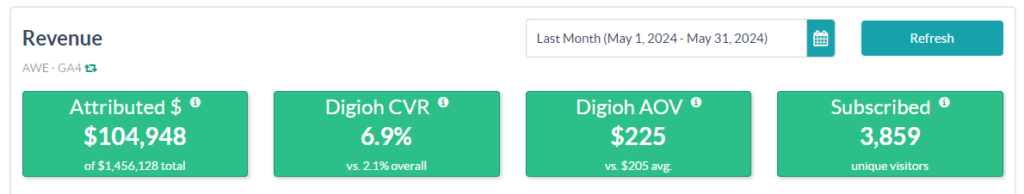
The Subscribers Key Metric is the number of unique site visitors for which Digioh collected either email or phone number (or both). While this is a good indicator of Digioh performance, note that it represents contacts ‘new to Digioh’, and so may include email/phone already in your Email/SMS platform.
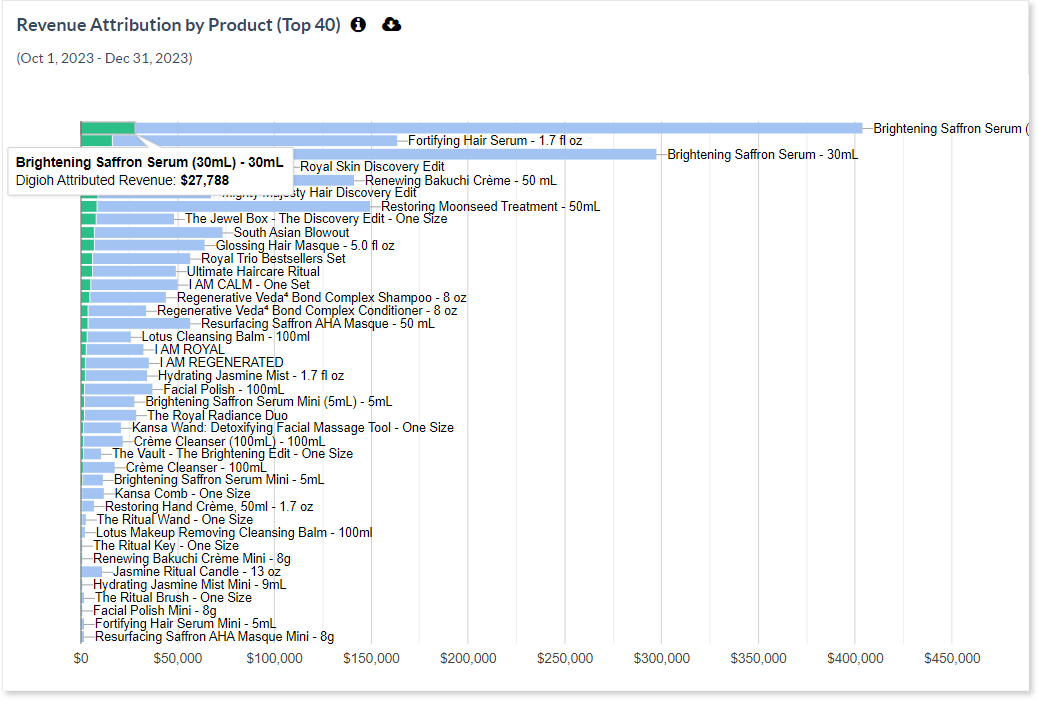
Revenue Attribution by Product (Top 40)
This report shows the breakdown of attributed revenue by purchase product (GA4 Item), showing both attributed and non-attributed revenue. Non-attributed revenue is purchases made on your site where the user did not engage with a Digioh Campaign.
In all Digioh reports, you can hover your mouse to see more detail, e.g. the exact amount of attributed revenue for a specific product.
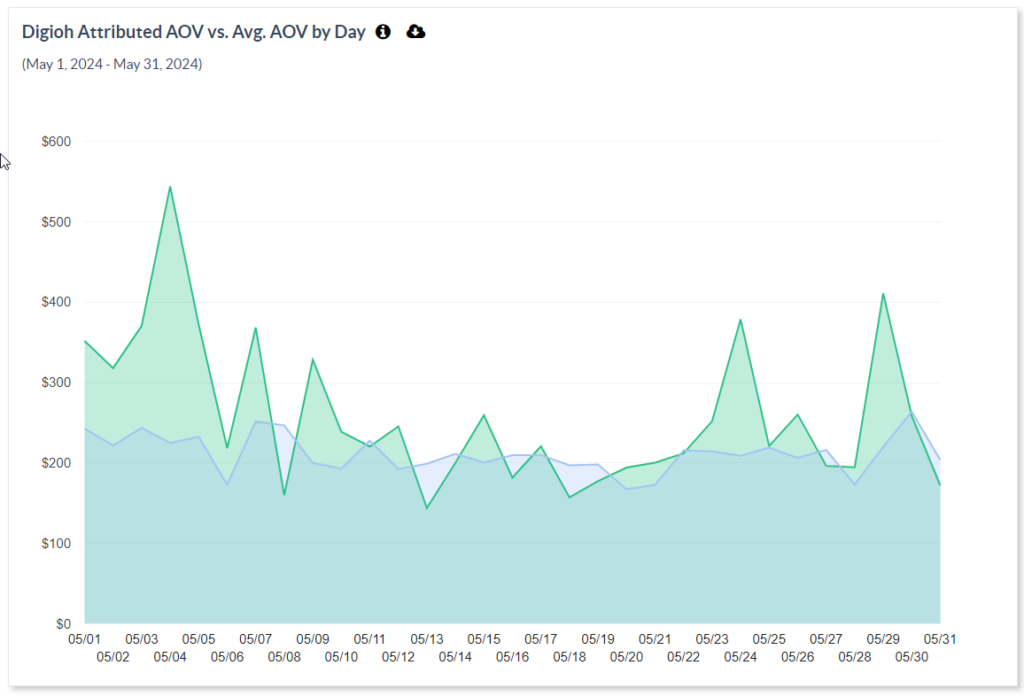
Digioh AOV vs. Avg. AOV
This report shows the trends in Average Order Value for Digioh attributed visitors vs. your site average. Typically this is higher for visitors that engage with Digioh Campaigns!
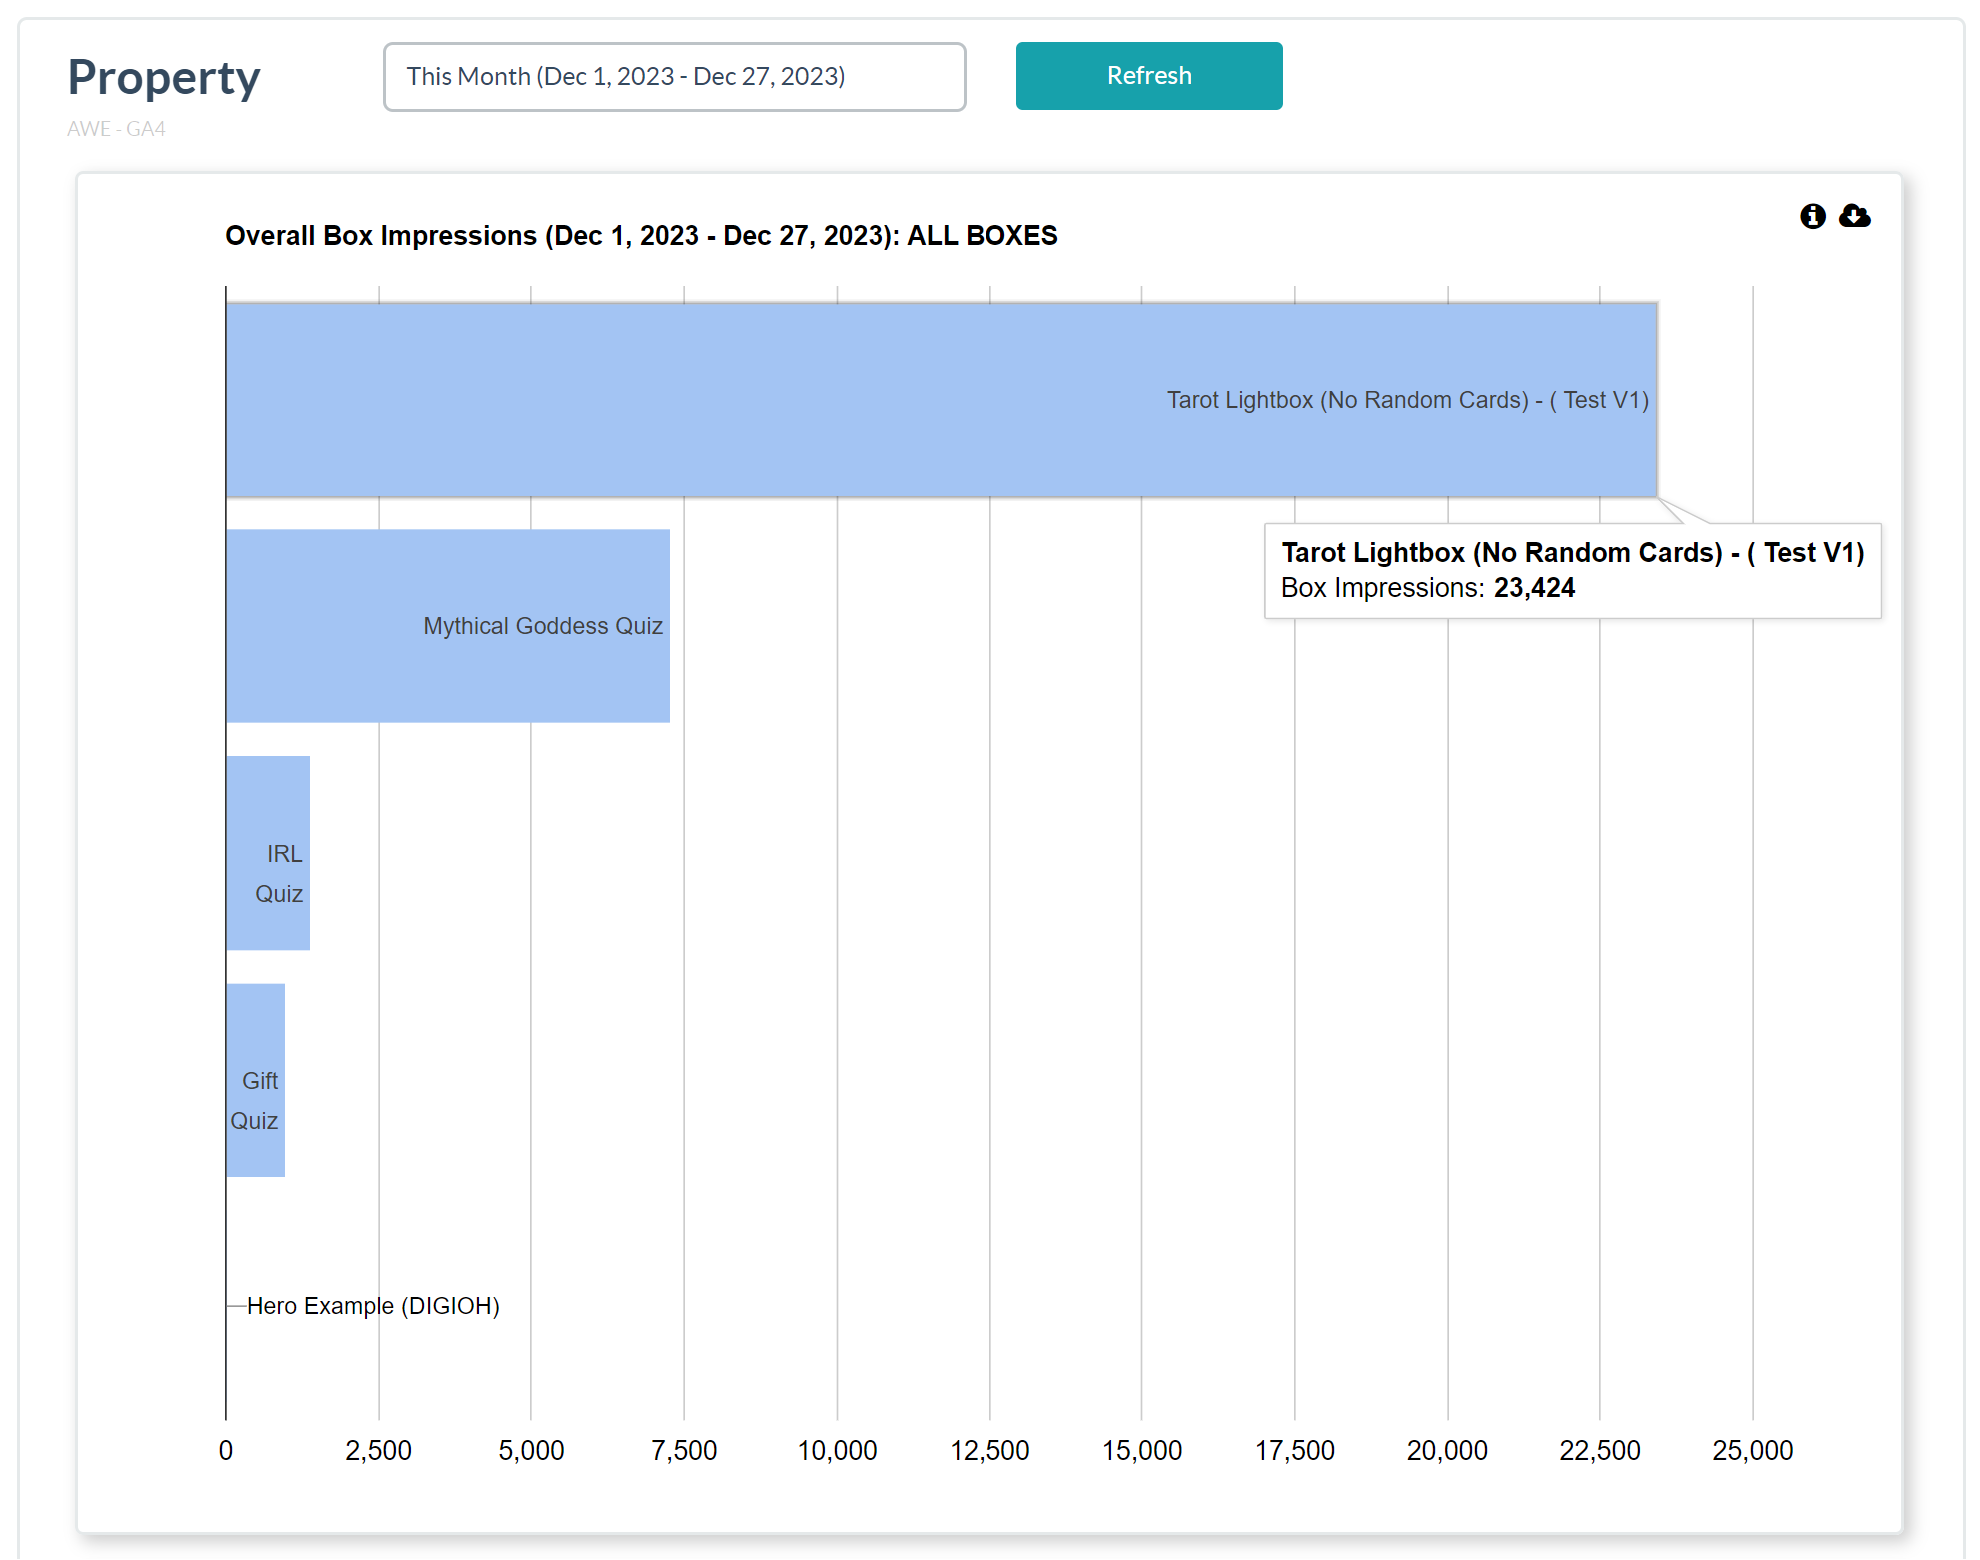
Property Analytics
Property Analytics shows data for your entire site:
- Overall Box Impressions
- Overall Box Audience Penetration
These reports can highlight where specific boxes may be oversaturating the user experience, or are being starved of impressions, either of which would indicate that an adjustment to Box Conditions is warranted.
Questions? Comments? Let us know at support@digioh.com