What You’ll Learn in This Article
-
How Digioh’s daily conversion report helps you monitor widget performance.
-
What data is included in the conversion report CSV.
-
How to enable daily email reports in your account settings.
-
Tips for using the report with tools like Tableau, Google Sheets, or Excel.
By the end of this article, you’ll know how to start receiving automated conversion reports straight to your inbox—and use them to boost your campaign effectiveness.
Keeping an eye on conversions can help you track how effective your widgets are. Digioh can send a daily conversion report CSV to you via email. You can import this data into Tableau, Google Sheets, or Microsoft Excel.
Here is what your CSV will look like:
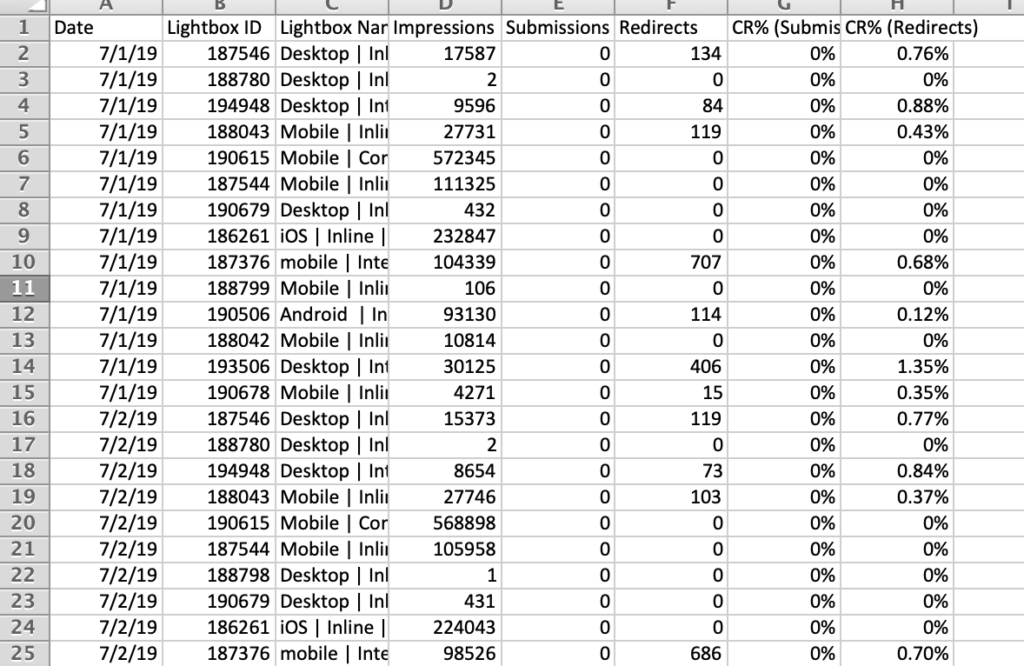
The CSV includes the Date, Campaign ID, Campaign Name, Number of Impressions, Number of Submissions, Conversion Rate Based on Submissions, and Conversion Rate Based on Redirects (if forms are turned off). The Report will update every day and has a monthly total at the bottom.The conversion report will also send a monthly report at the end of each month.
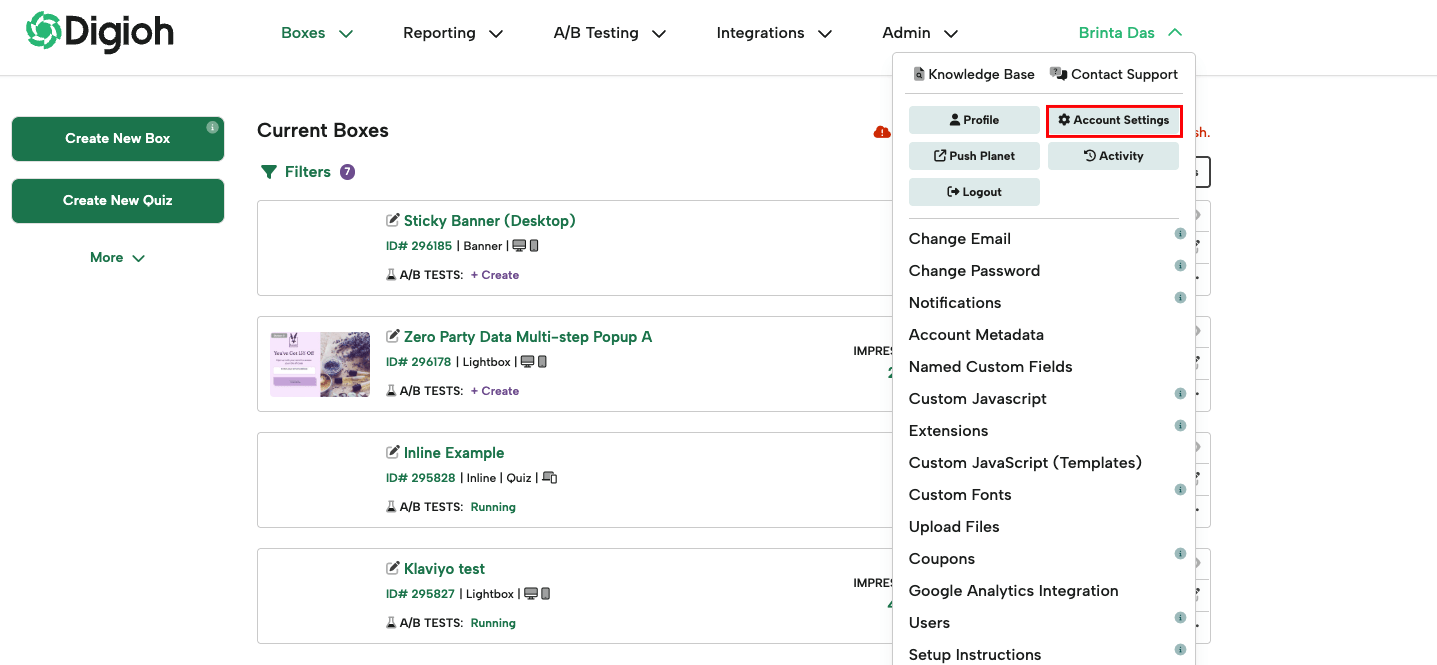
To enable daily reports, go to Account Settings:
Turn on Conversion Reports, set an email address where the reports will be sent, and save your changes. You can add multiple emails by adding comma-separated values.
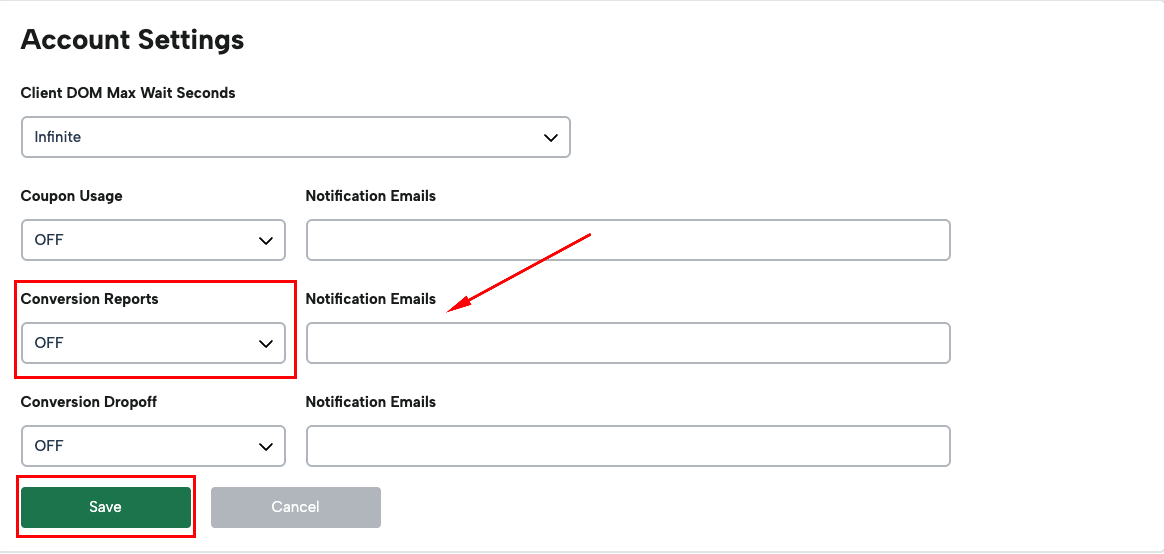
You will now receive conversion reports in your inbox!