By connecting Google Analytics 4 (GA4) to Digioh, you can see many types of reports.
Please select the following to see details on each Report type:
- Prerequisites for Reporting
- Navigating the Reporting Dashboards
- Revenue Analytics Dashboard
- Identity Analytics Dashboard
- Property Analytics Dashboard
Prerequisites:
- Enabled Enhanced eCommerce in GA4.
- Connected Digioh to GA4, Install the App and Create Audiences and Dimensions
After setting up prerequisites, there will be no data immediately available to Digioh reports since GA typically lags by up to 24 hours.
Navigating the Analytics Dashboards
To get to the different analytics dashboards, find the “Reporting” button in the navigation of your account. From here, click that button and select the dashboard you would like to navigate to from the dropdown:
Throughout the Analytics Dashboards, there are tooltips that can be found by hovering over the overview boxes listed towards the top of the page, as well as by hovering over the information icon on the individual charts:
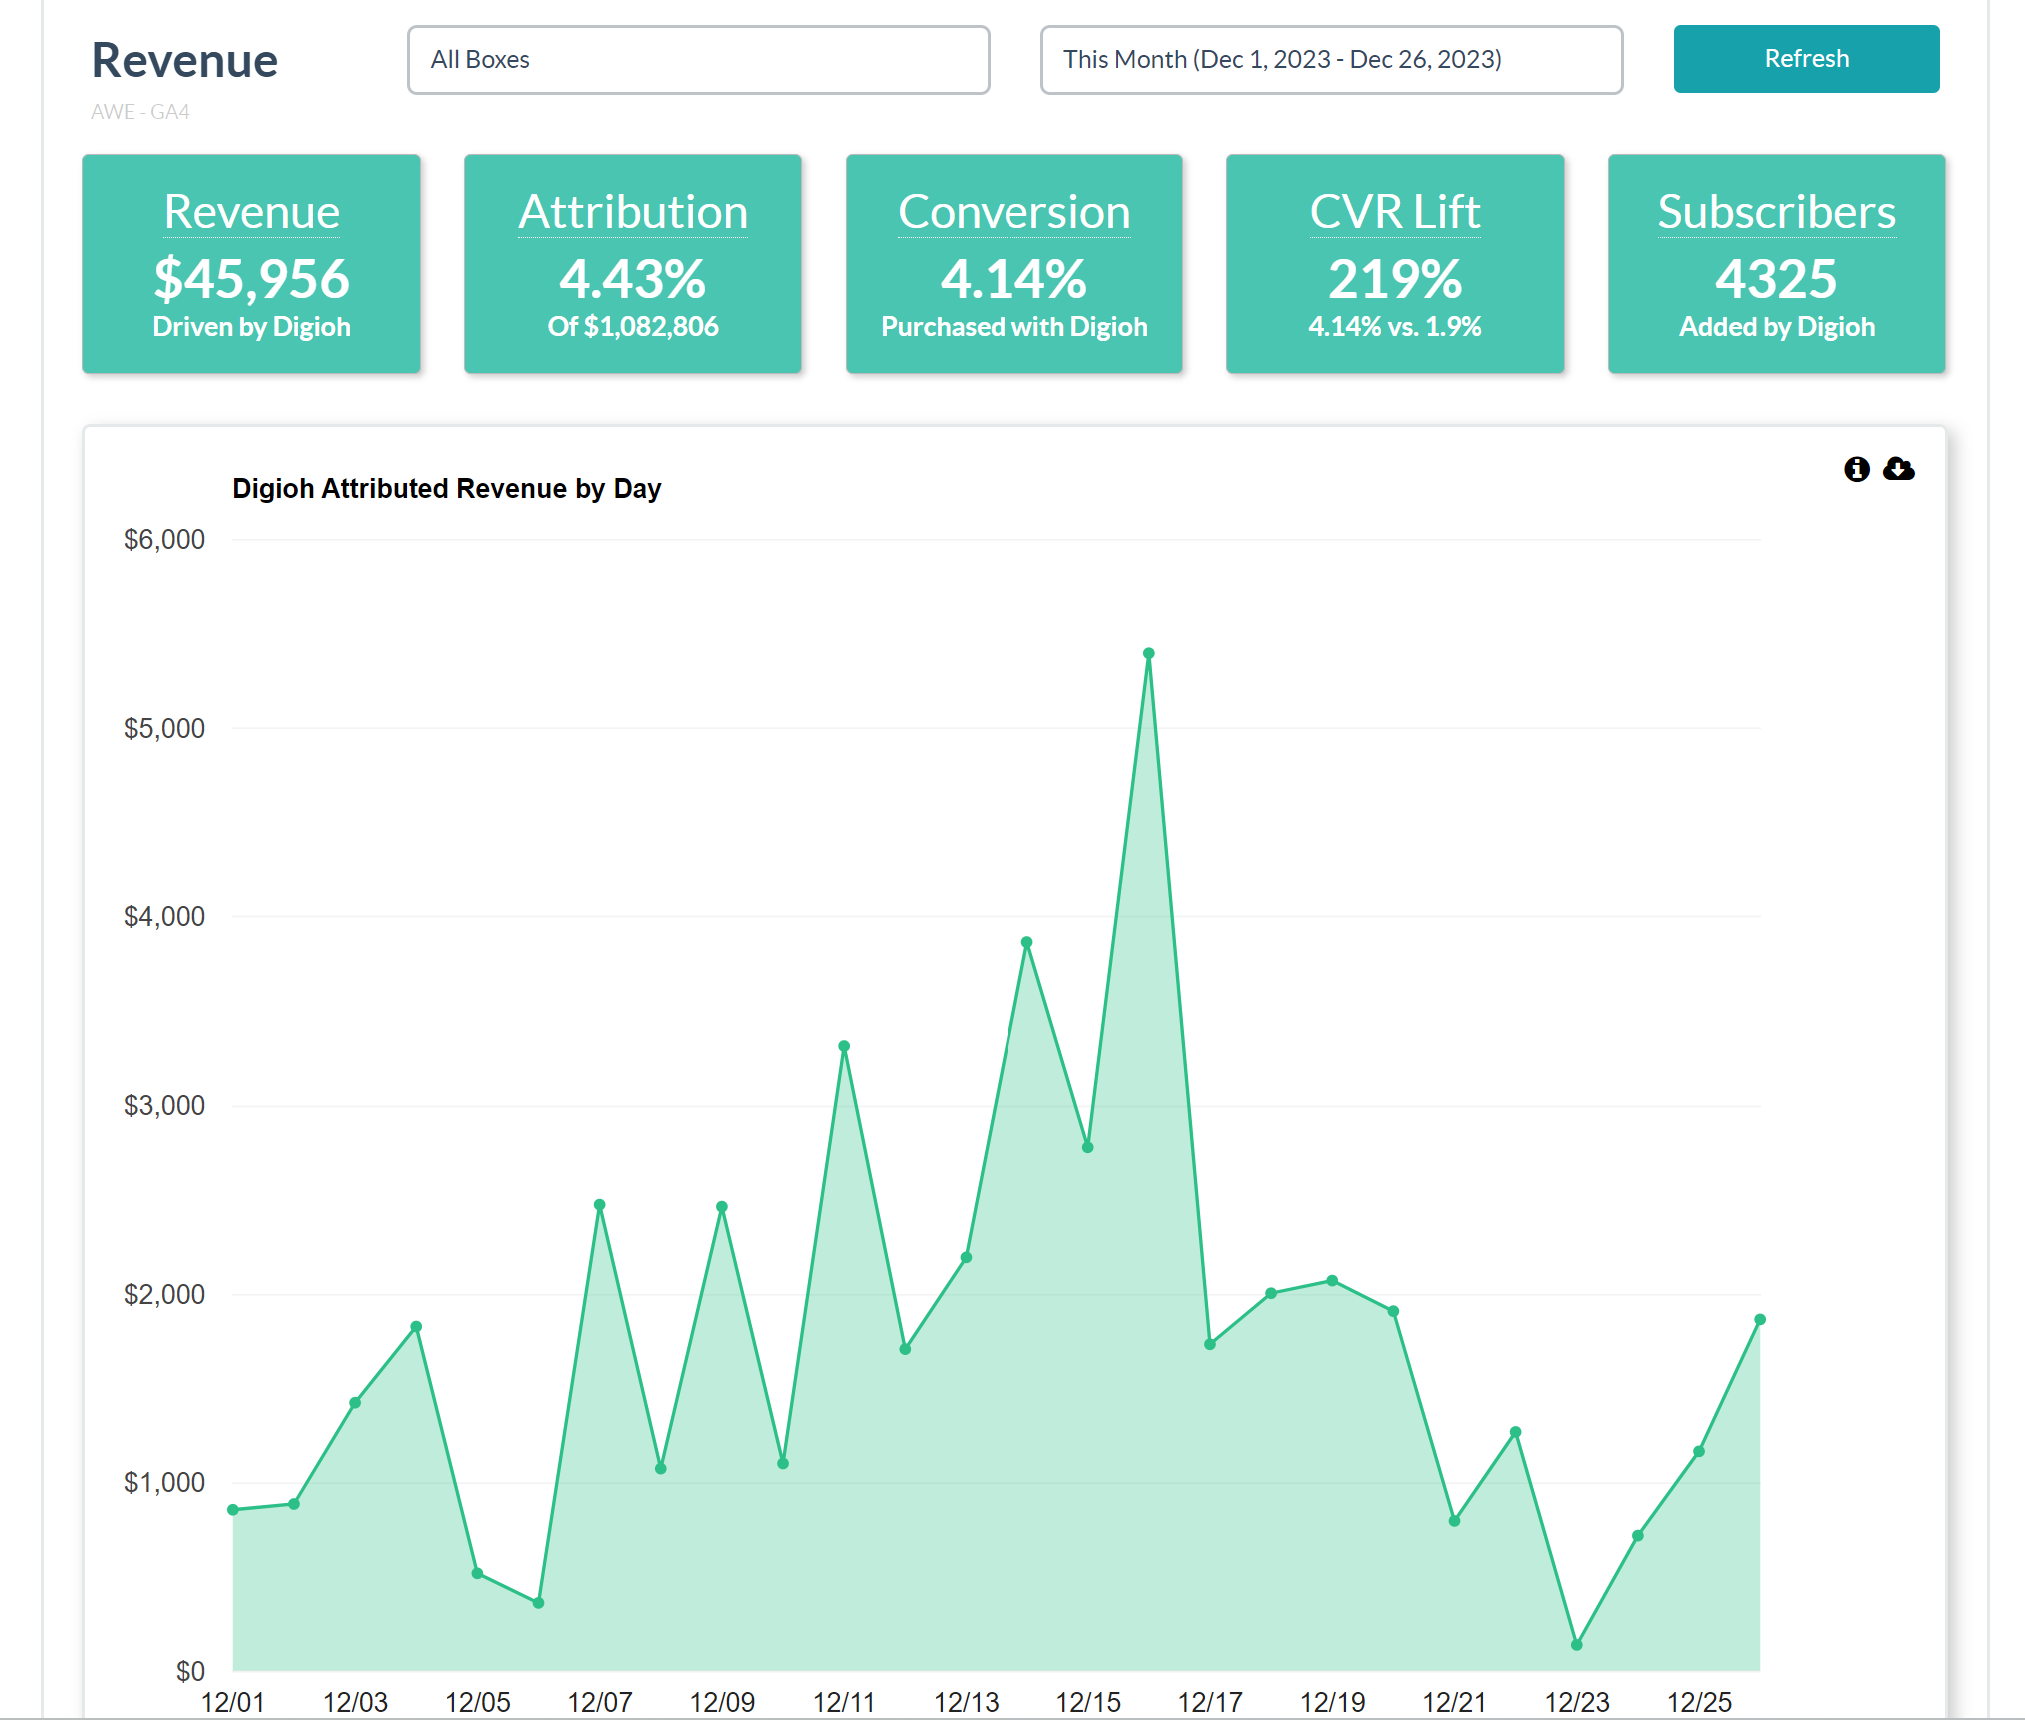
Revenue Analytics Dashboard
Digioh Revenue Analytics is based on eCommerce purchase data in GA4 in conjunction with Digioh Standard Events.
All of the key revenue metrics are based on the Digioh Revenue Attribution audience you created during setup. You can modify this Custom Audience in GA4 to reflect whatever attribution model you desire. By default, Digioh will claim attribution for purchase transactions when a visitor session:
- Submits a Digioh Box form, or
- Redirects from a Digioh Box, and
- Completes a purchase in the same calendar day
Product Recommendation Quizzes typically submit and redirect at the end, so Digioh attribution will be based on quiz completion.
Revenue Analytics metrics are calculated for the selected reporting period as follows:
- Revenue: total transaction revenue attributed to Digioh.
- Attribution: % of Digioh Attributed Revenue to your Total Revenue.
- Conversion: eCommerce conversion rate for Digioh Attributed sessions.
- CVR Lift: Digioh attributed eCommerce conversion rate vs. all visitor eCommerce conversion rate.
- Subscribers: the number of email or phone numbers collected by Digioh Boxes
Identity Analytics Dashboard
There is an Identity Analytics dashboard that will show KPI tiles. This dashboard will show when a TPAU app is installed.
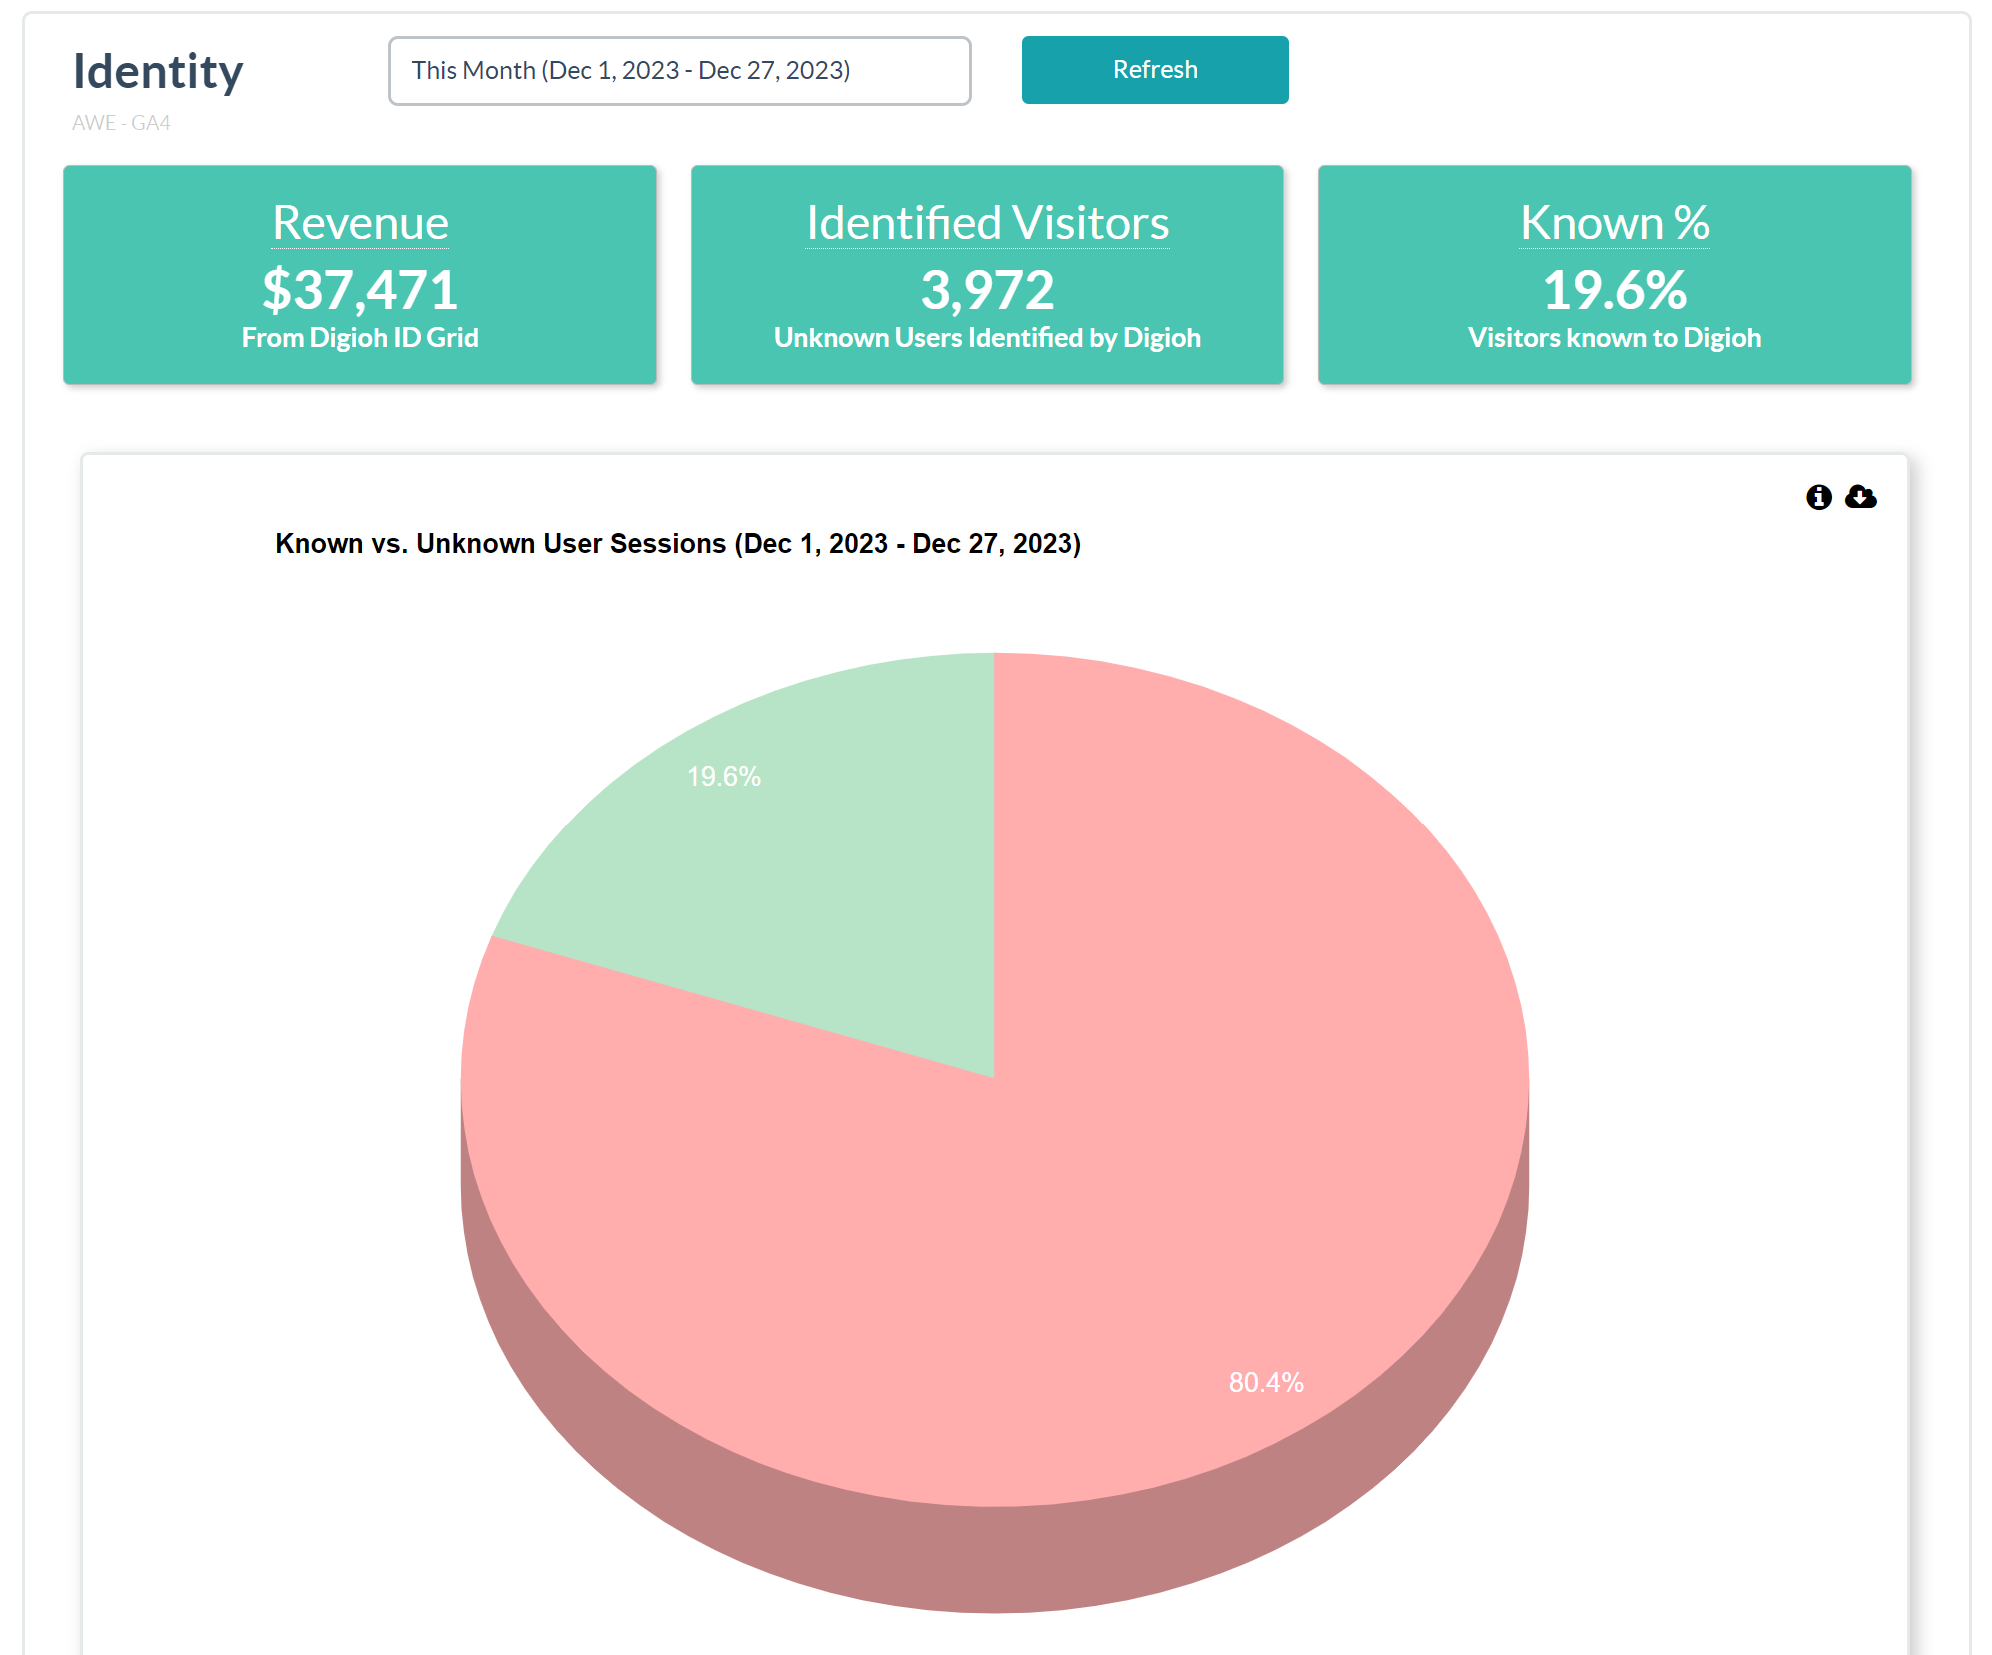
This dashboard will show data according to identity properties, such as:
- Known vs Unknown User Sessions
- Incremental Revenue Contribution due to Digioh ID Grid Activity by Day
- ID Grid Actions for Browser-Device
- Visit Identification Over Time
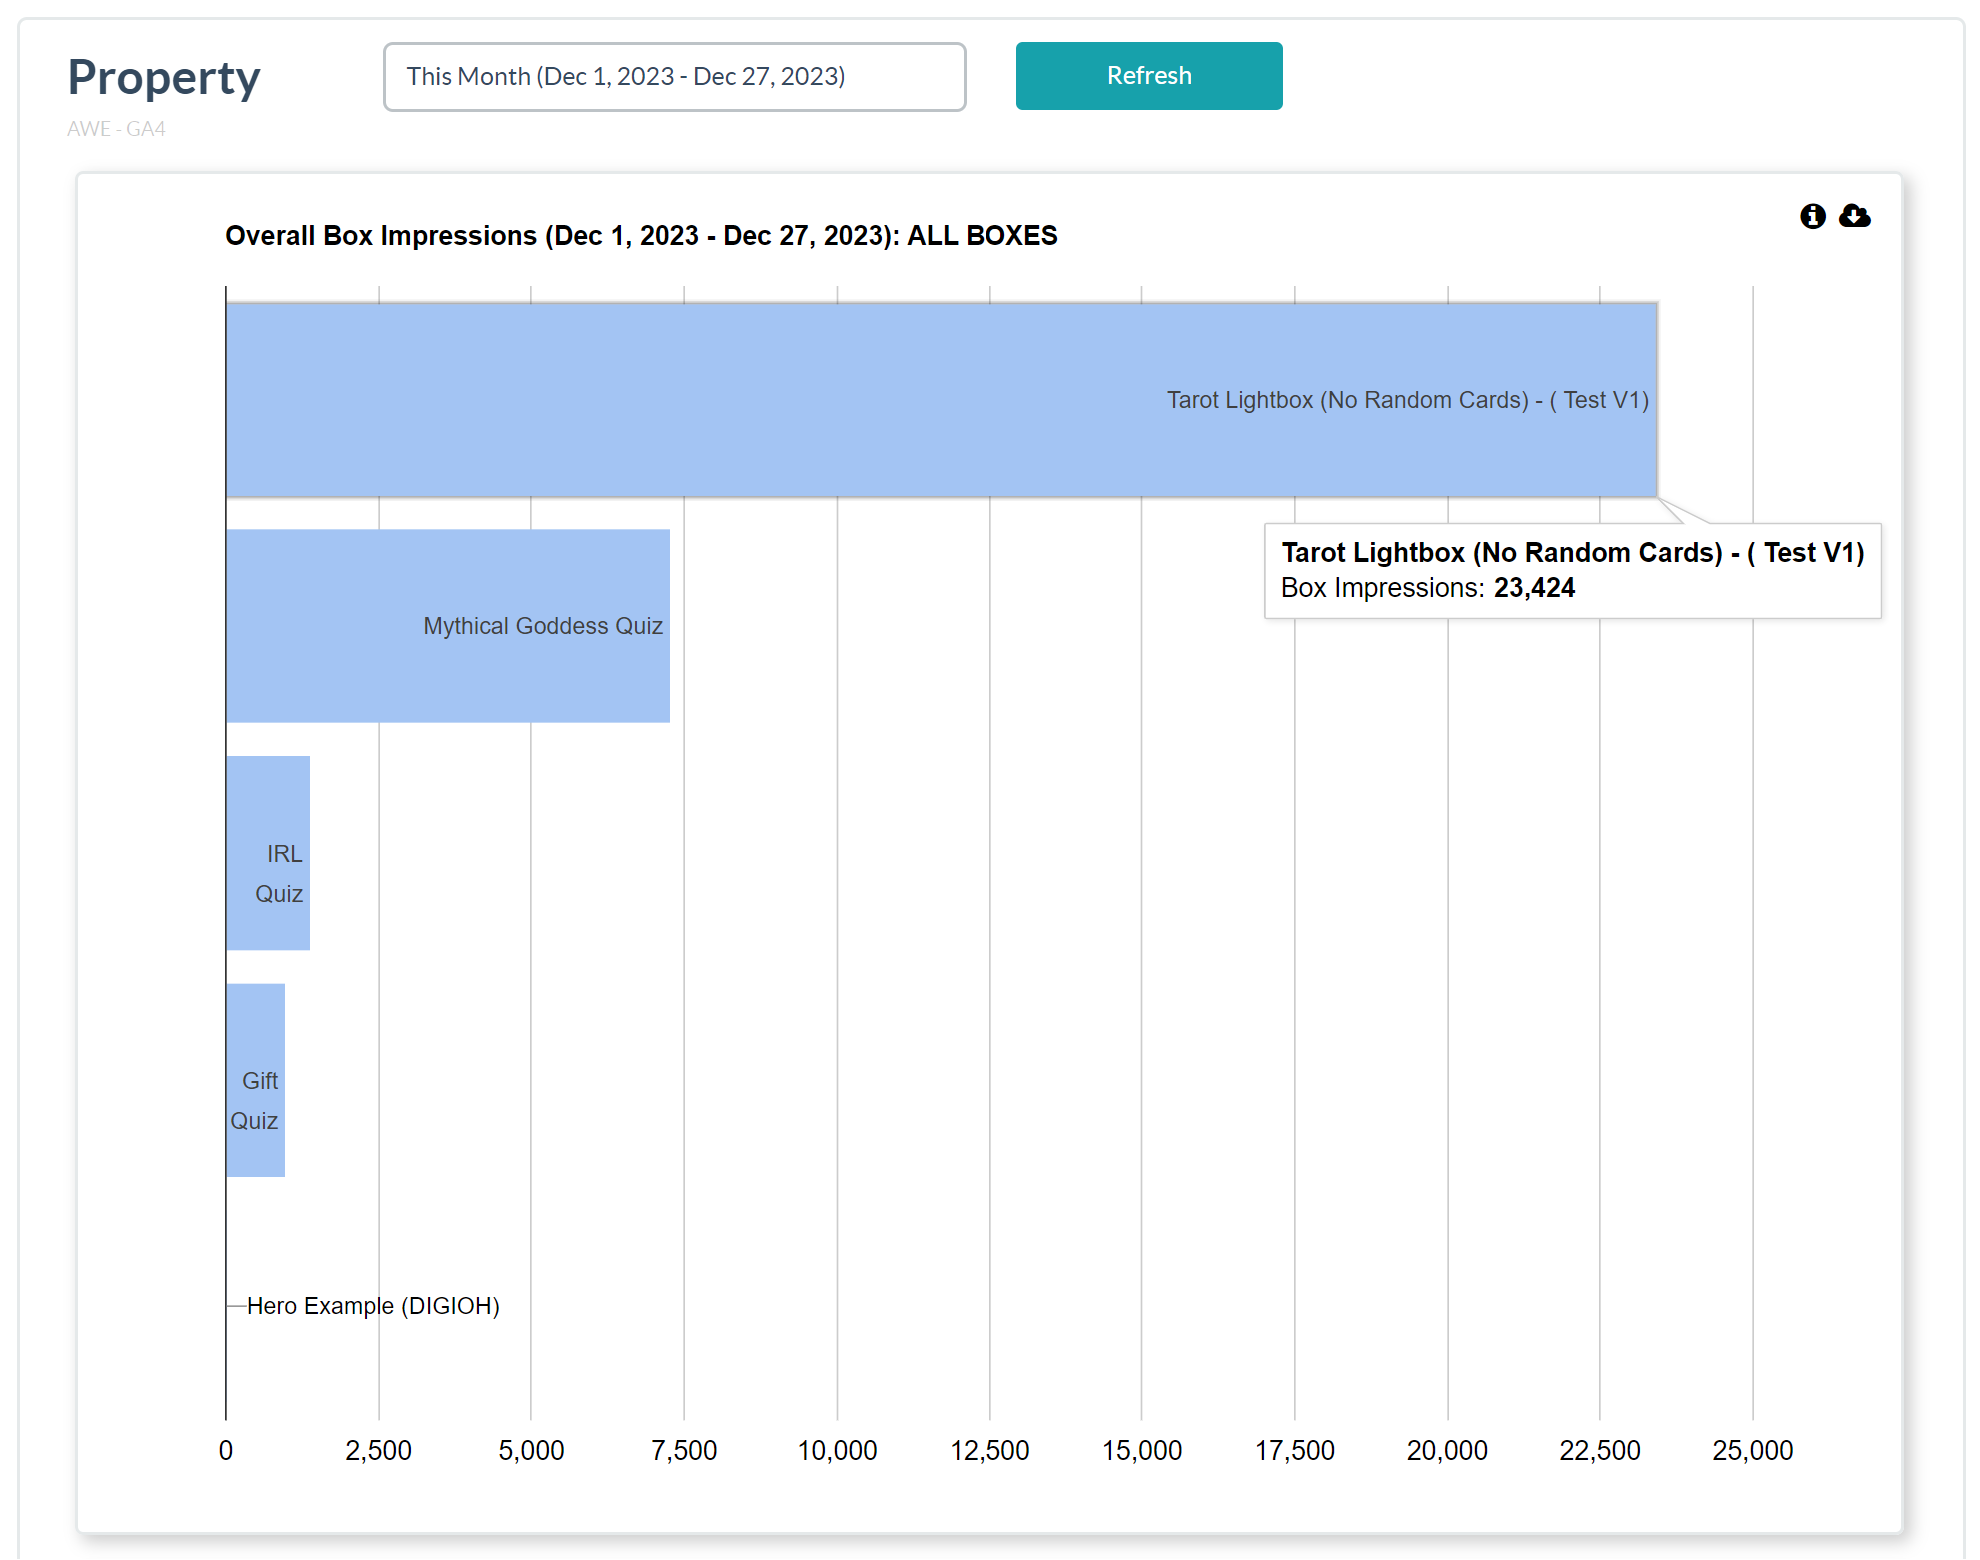
Properties Analytics Dashboard
There is a Property Analytics dashboard that will show data according to properties, such as:
- Overall Box Impressions
- Overall Box Audience Penetration